Tl;dr: NEPA would apply to 5-6% of estimated future clean energy capacity according to NREL modeling, similar to the historic deployment rate.
There is little doubt we need to comprehensively improve infrastructure permitting and environmental reviews at all levels of government in the U.S.. Making additional legislative changes to NEPA as part of those reforms could be a useful contribution to broader permitting reform.
But how important is NEPA (and other federal permitting processes) for renewable energy deployment? Would reforming those federal processes unlock substantially more renewable energy development on federal land?
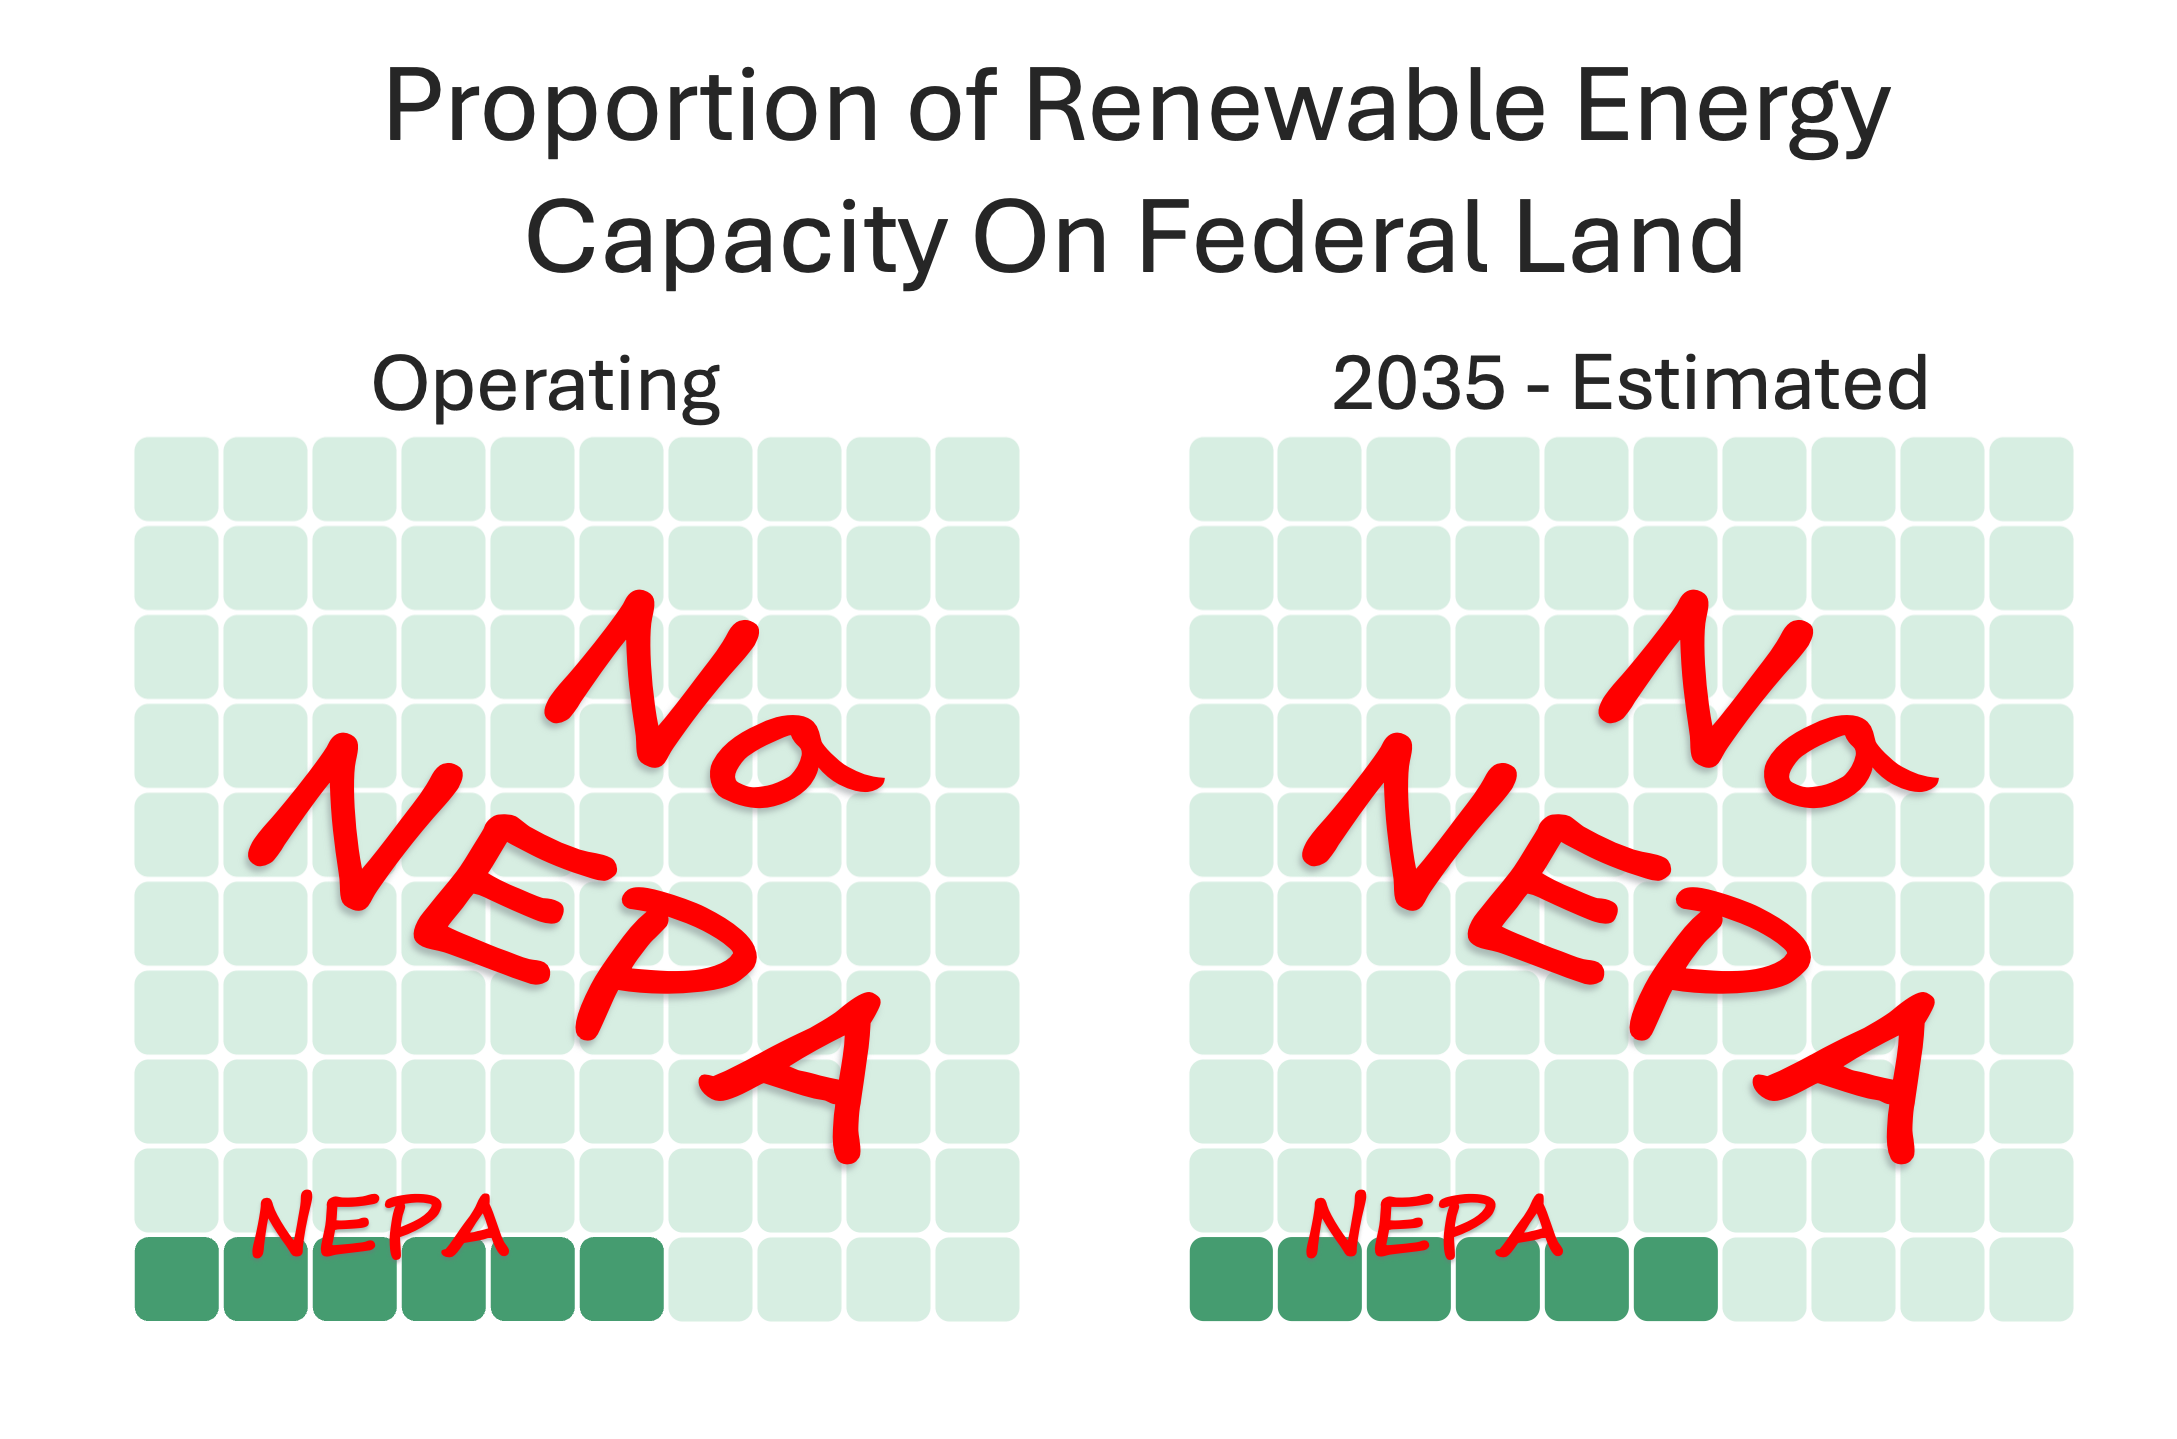
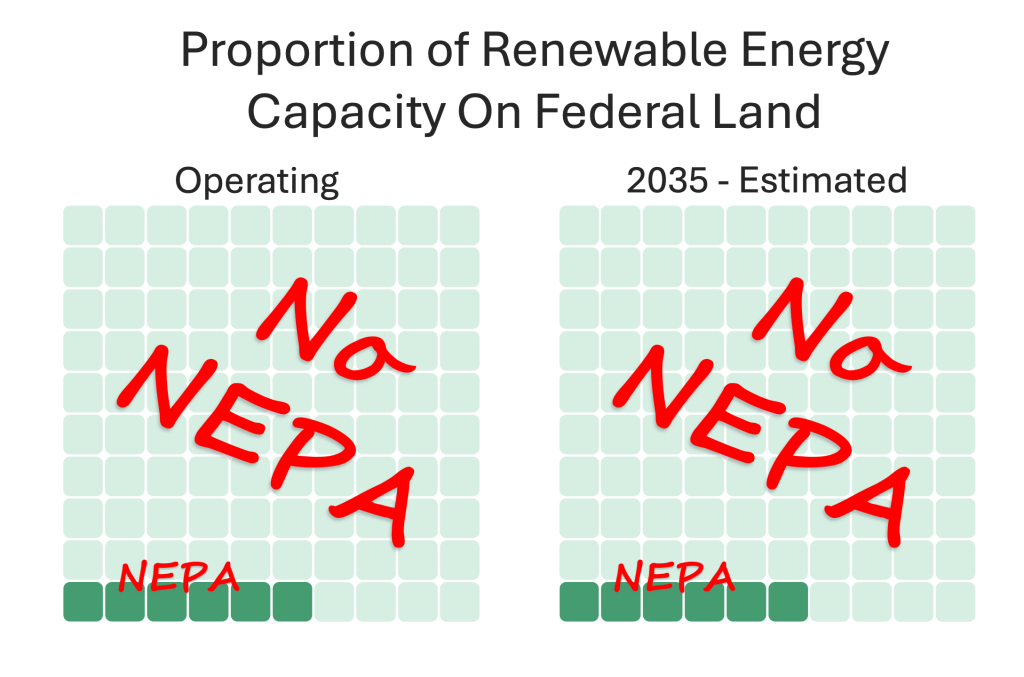
NEPA reviews have been done in connection with projects providing about 5-6% of operating renewable energy projects (defined as utility-scale solar, wind, and geothermal). Most of those renewable energy projects were covered by NEPA because they were on federal land (3.7% of total renewables in the United States).[i] Some additional renewable generation projects were also impacted by NEPA reviews because their grid connecting transmission lines crossed federal land (approximately 2% of total renewables in the U.S.). Counting those “Gen-Tie” projects raises the percentage of renewables that have been subject to NEPA to just under 6%.[ii]
This excludes long-distance transmission lines that are subject to NEPA reviews at a higher rate (estimated at 26% of total miles) than renewables projects have been. Transmission will be covered in a subsequent post.
Some commentators have looked at this historic deployment rate and argued that NEPA is a relatively unimportant obstacle to renewable energy deployment in the aggregate.[iii]
Others have countered that the relatively low percentage of renewables deployment on federal land is driven by a “selection effect.” Because NEPA (and federal permitting generally) is so onerous, the argument goes, developers pass up on economic development opportunities on federal land in favor of more streamlined reviews on private land.[iv] If NEPA were less of an obstacle, then perhaps there is substantial unrealized renewables potential on federal land that could be unlocked.
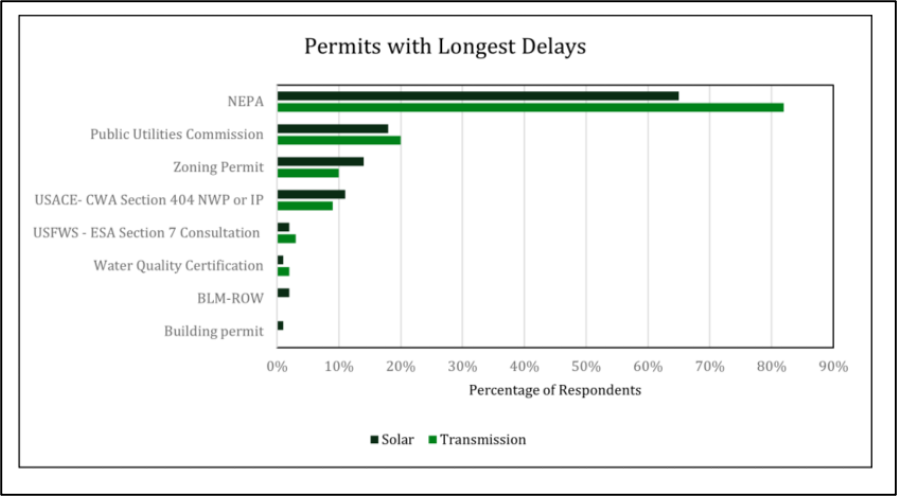
The argument that federal permitting requirements (including NEPA reviews) is causing low rates of deployment on federal land has a few compelling points in its favor. First, a recent survey of developers found that they overwhelmingly identified NEPA as the process with the longest delays among federal, state, and local processes.[v]
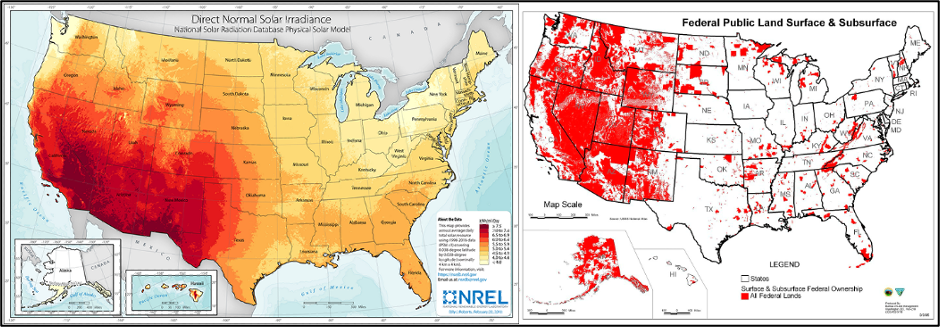
Second, as noted by those arguing for the selection effect, there is a geographic overlap between federal public land in the west the best solar resources are (as measured by solar irradiance).[vi]
An analysis done by the Department of Energy (DOE) in 2024, however, shows that future deployment on federal land is unlikely to exceed around 5-6% of total renewables deployments over the next decade,[vii] regardless of NEPA or other federal permitting reforms. (Full disclosure, the Author was part of the DOE core team overseeing the project while he served in the DOE Office of Policy.)
DOE had the then-named National Renewable Energy Laboratory (NREL) conduct the first comprehensive modeling exercise to estimate the technical and economic potential for renewable energy deployment on federal land (utility-scale solar, wind, and geothermal). NREL engaged in an extensive inter-agency effort to understand competing land uses, social and environmental factors, and technical considerations. Based on those, NREL produced a detailed assessment of the technical potential on federal land.
The analysis showed that there is substantial technical potential for development on federal land – 5,700 GW of solar potential and 900 GW of wind (the majority of the potential is on BLM land). For context, this is a bit less than 10% of the total technical potential in the continental united states for each technology.
The NREL used a cost-optimization model to estimate renewables deployment under a variety of power sector scenarios with different assumptions about technology costs, siting and permitting constraints, and other factors.
The models did not treat federal land and private land differently with respect to deployment costs. In other words, the models chose the lowest cost location(s) to deploy renewables (and other energy generation) without respect to control of the land.
The study authors found: “Except for the Federal Lands Favorable scenario, all other scenarios result in 2%–5% of total deployed capacity located on federal land in 2035 [], which is consistent with the current share of 3.7%.”[viii]
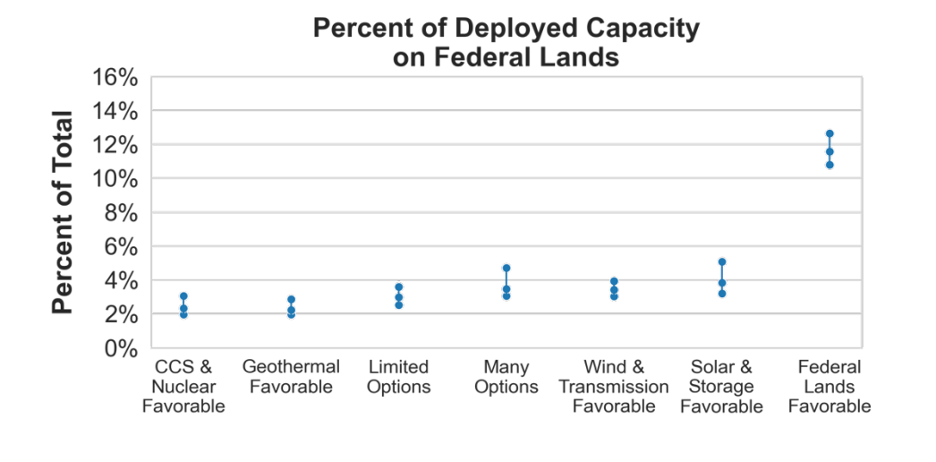
The Federal Land Favorable scenario included deployment as high as 12.5%. What drove that higher relative proportion of renewables on Federal Land? The driver in that scenario was a set of assumptions to set more stringent siting restrictions renewables only on private land, including:
- Increasing assumed setbacks by two to three times more than the reference case
- Not allowing any development in big game migration corridors (compared to 50% in the reference case)
- Prevented all private land development in Lesser Prairie Chicken core habitat
These additional restrictions reduced the technical potential on private land by approximately 50% (from 76,000 GW in the reference case to 39,000). Or stated another way, blocking 36,000 GW of technical development potential from private land only moved an additional 150 GW of renewable energy deployment to Federal Land.
Ultimately, the conclusion from the modeling estimates is that unless the relative economics of deploying on private land get substantially worse, or the economics on federal land get substantially better, the estimated proportion of deployment is about what the historic proportion has been — 5%.
Why does the deployment model seem to deploy a slightly higher proportion of renewables to private land instead of federal land given the apparent high correlation between high-quality solar resources and federally owned land?
The answer is relatively straightforward — most of the technical potential on federal land is for utility scale solar that is land relatively farther from population centers than private land options. The quality of solar generation varies less than wind generation, meaning solar can be sited closer to demand centers than wind and is less dependent on long-distance transmission.
Princeton Zero Lab described this phenomenon succinctly in its examination of the Biden-era infrastructure bills: “The majority of new transmission capacity is driven by the need to interconnect wind farms. Wind power quality varies much more across sites than it does for solar PV, and populated areas tend to be farther from the best wind resources. That means solar PV projects have greater siting flexibility and generally require less long-distance transmission per gigawatt.”[ix]
In short, fundamental economics lead to a lower proportion of renewables deployment on federal land versus private land than the proportion of federal land versus private land. The historic proportion of renewables deployment on federal land, 5-6%, matches the estimated proportion over the next decade.
Additional Notes:
- As with any modeling exercise, the assumptions and nuances are important. Readers are encouraged to review the Land of Opportunity report for a full description of the model parameters and assumptions.
- The model used in the Land of Opportunity report did not include attempts to account for different permitting regimes. This meant that the model generally didn’t impose any additional costs to locate on federal land than on private land. Given the various developer surveys identifying NEPA costs and delays as an additional obstacle, that means the model would have a tendency to over estimate the capacity deployed to federal land.
- On the other hand, other factors could lead the model to underestimate the attractiveness of federal land, such as being able to avoid negotiating with multiple landowners to assemble land for a project.
- The model’s underlying supply/demand scenario was a 100% clean electricity system by 2035, consistent with the then-existing administration policies. While overall renewables deployment rates in such a scenario are higher than current trajectories, we do not believe that impacts the economic factors relative to siting a project on federal v. private land.
- The focus of this piece has been on the proportion of renewables capacity on federal land. This is not to discount the significance of the absolute capacity (50-80 GW in the core scenarios) that could be deployed on federal land but is largely blocked by current administration policies.
- As noted, these estimates do not include the impact that NEPA application to transmission lines may have on renewables deployment. A recent study found that over the past decade approximately 25% of transmission line miles were subject to NEPA (3% of projects).
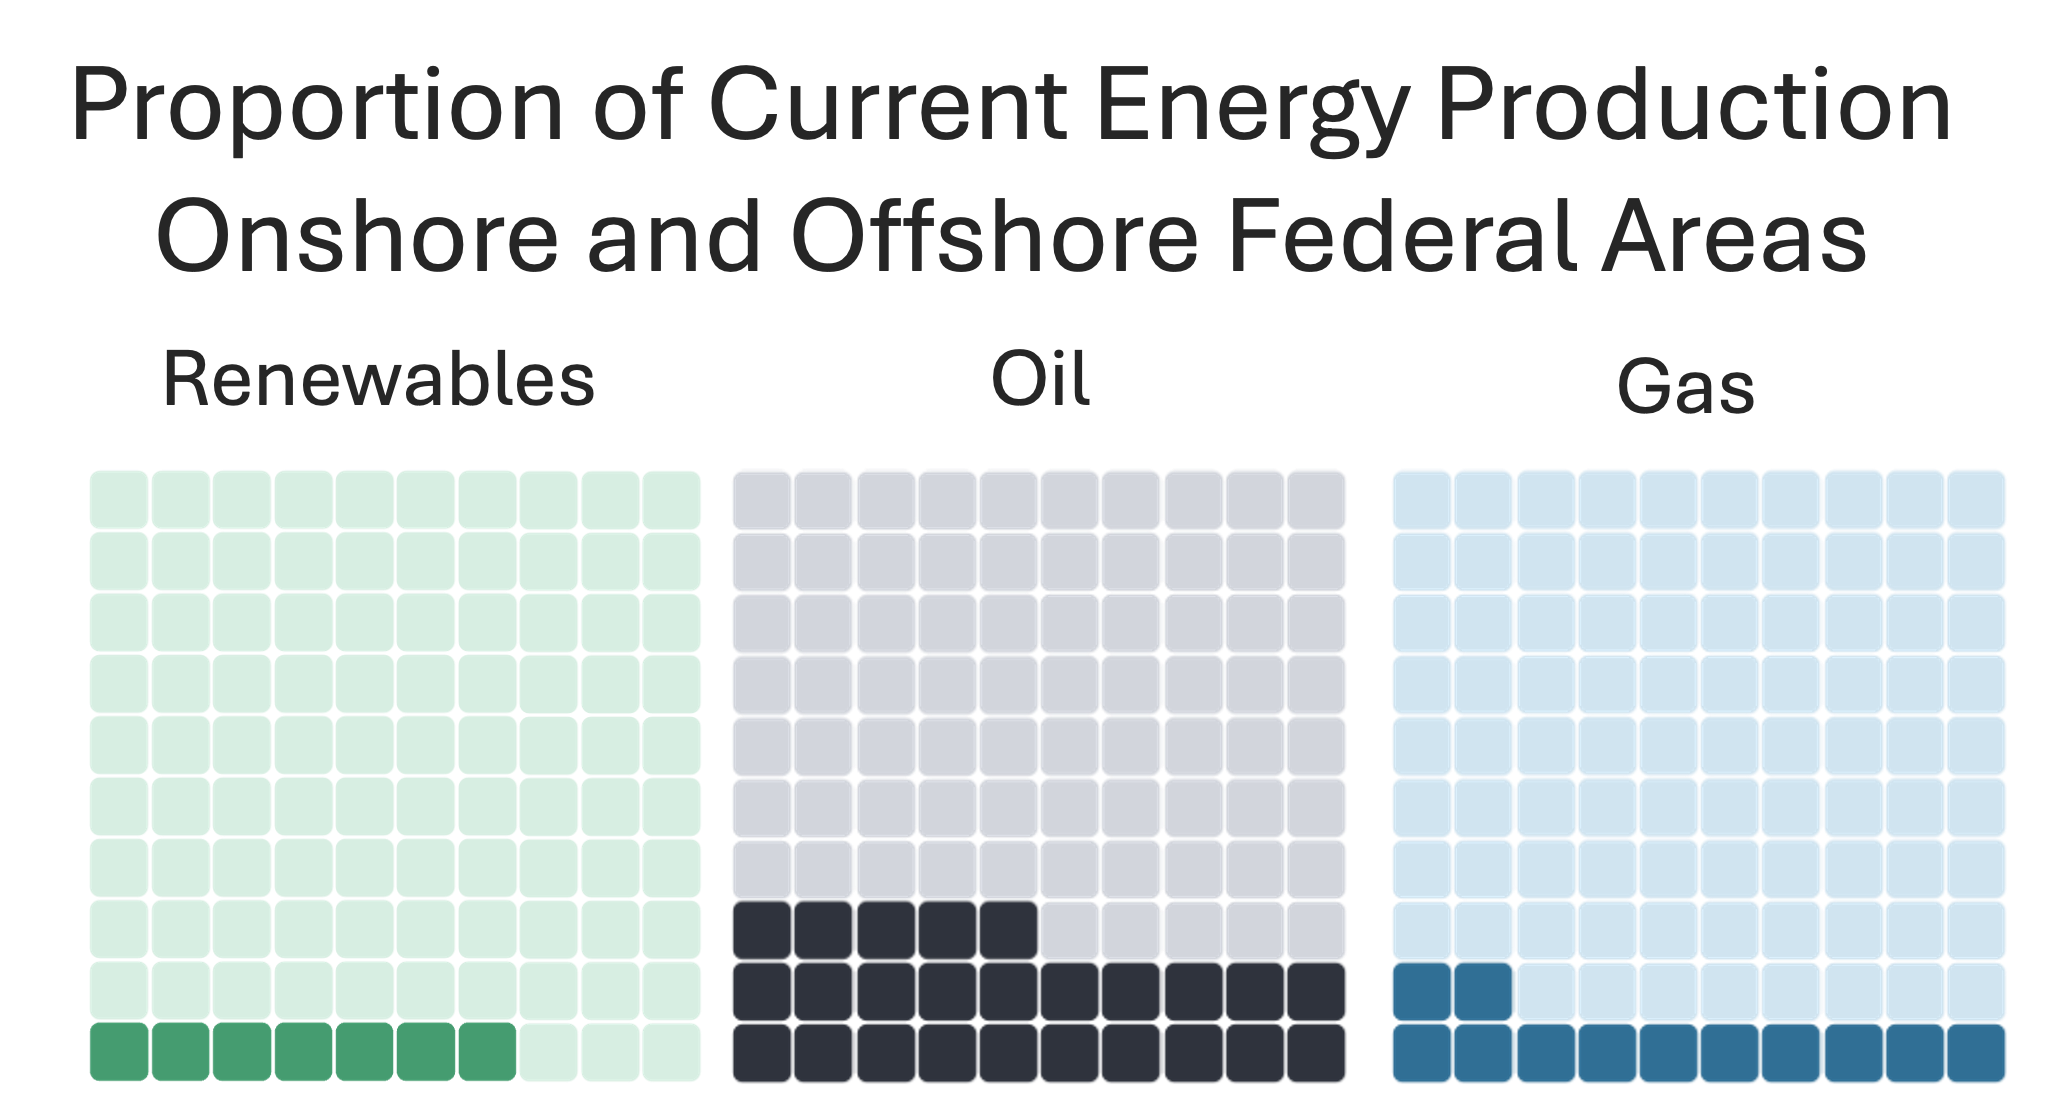
- How does the proportion of renewable energy located on federal land compare to other energy sources such as oil and gas production? The Land of Opportunity report noted that, including offshore production, the proportion for oil and gas was 25% and 12% respectively. (Including potential offshore wind production of 48 GW as well,as projected in NREL 2024 Standard scenarios, would increase the renwables proportion to approximately 7% in 2035).
[i] Mai, et. al, “Land of Opportunity: Potential for Renewable Energy on Federal Lands,” National Lab of the Rockies (née National Renewable Energy Laboratory) available at: https://docs.nrel.gov/docs/fy25osti/91848.pdf
[ii] Data on operating projects including Gen-tie lines available here.
[iii] Adelman, “NEPA Reform’s False Choice,” Ecology Law Quarterly, available at: https://www.ecologylawquarterly.org/wp-content/uploads/2024/12/51.1-Adelman-Internet-Ready.pdf
[iv] Mckenzie, “How NEPA will Tax Clean Energy: The National Environmental Policy Act has become a barrier to environmental policy,” Institute for Progress, available at: https://ifp.org/how-nepa-will-tax-clean-energy/#clean-vs-fossil-energy
[v] “Pathways to Accelerating Clean Energy: Assessing Non-Cost Barriers,” Third Way, available at: https://uploads.thirdway.org/downloads/full-research-findings-pathways-to-accelerating-clean-energy-pace-report/Full-Research-Findings-Pathways-to-Accelerating-Clean-Energy-PACE.pdf
[vi] NREL & Bureau of Land Management via McKenzie IFP
[vii] Land of Opportunity
[viii] Land of Opportunity
[ix] Jenkins, “Climate Progress and the 117th Congress: The Impacts of the Inflation Reduction Act and Infrastructure Investment and Jobs Act,” Princeton Zero Lab https://repeatproject.org/uploads/reports/REPEAT_Climate_Progress_and_the_117th_Congress.pdf